Definition #
Ichimoku is a set of tools that helps us understand where price is headed, how strong that movement is, and where it might stop or change direction.
Calculation #
The Ichimoku chart uses price averages from different time periods to create its lines and cloud. Think of it as looking at the average price over the past week, the past month, and the past two months, and using that information to draw lines in the future and past of the chart.
- Two lines (one fast and one slow): They help us see the short- and medium-term trend. When the fast line crosses above the slow line, it could be a sign that the price is going up. When it crosses below it, it could be a sign that it is going down.
- A “cloud” formed by two lines projected into the future: This cloud shows us possible areas where the price could find support (if it is above the cloud) or resistance (if it is below). If the price is within the cloud, the market could be indecisive. The thickness of the cloud gives us an idea of how strong that support or resistance might be.
- A line that shows the current price but moved backward in time: This line helps us confirm the current trend. If this line is above past prices, it suggests a bullish trend. If it’s below, it suggests a bearish trend.
Interpretation #
The Ichimoku gives us several important clues:
- The Cloud: This is the most important part. If the price is above the cloud, the trend is generally considered bullish; if it’s below, it’s bearish. The cloud acts as a zone where the price might have difficulty breaking through.
- The two lines (fast and slow): Their intersections can be signals to buy or sell. They can also act as support or resistance levels.
- The line moving backward: It helps us see if the current trend is supported by what happened in the past.
Example #
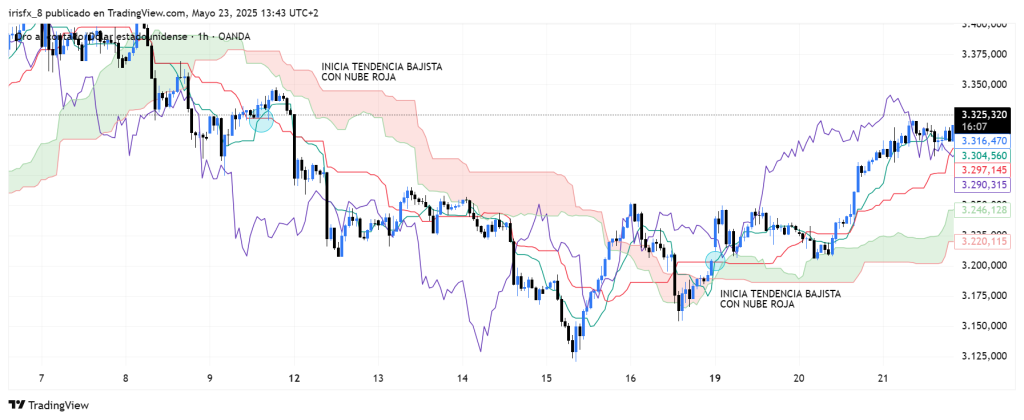
In this case, there are several points to consider. The cloud, formed by two lines that, when they cross, indicate an upward or downward trend (green or red, respectively), the purple line (Chikou Filter), and two lines, one fast and one slow (Tenkan and Kijun).
To open an order, which in this case will be a sell, the cloud must be above all three lines, the Chikou filter must be below the other two lines, and finally, the trigger signal will be when the Tenkan line (green) crosses the Kijun line (red). When the first two lines occur and the instant they cross, a sell order will be opened. When these three lines occur, but in reverse, the sell position will be closed, seeking a buy position.
Parameters #
Signal type
The element can operate in two modes. In trigger mode, it provides a signal the instant the element condition occurs. At all other times, even if the condition persists, trigger mode will not provide further signals (until a new condition is reactivated). In filter mode, it will provide a signal as long as the element is generating a signal.
These are the 2 options:
- Filter: while the signal is produced
- Trigger: at the moment the signal is produced.
NOTE: It is recommended to keep only one element with trigger signal type per rule, and the rest of the rule elements (optional) as filters.
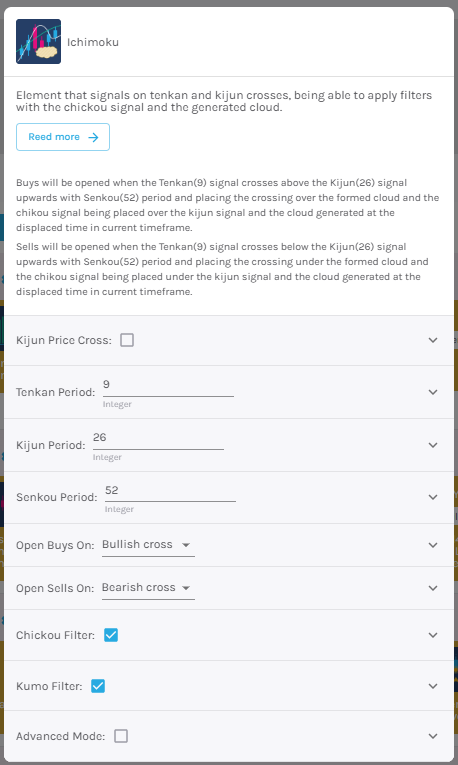
Parameters configuration
Kijun Price Crossing – Select the option for kijun crossing mode with price.
Tenkan Period – Calculates the average of the highs and lows of the selected periods to display price volatility [default: 9].
Kijun Period – Calculates the average of the highs and lows of the selected periods to show the long-term trend [default: 26].
Senkou Period – These lines form a cloud, which is calculated using the Tenkan and Kijun average of the selected periods [default: 52].
Open buy order on – Select buy action, choosing between bullish or bearish signal [default: Bullish signal].
Open sell order on – Select sell action, choosing between bullish or bearish signal [default: Bearish signal].
Modo avanzado: Timeframe – Selecciona el Timeframe sobre el cual se aplicará el elemento. Estas son las opciones:
- Current: This refers to the timeframe associated with the strategy to be validated. For example, if our strategy is associated with the EURUSD in 15 minutes, the current timeframe will be 15 minutes. If we want to use this element with a different timeframe than the one used in the strategy, we can set it with the rest of the options.
- 1 min: 1 minute timeframe.
- 5 min: 5 minute timeframe.
- 15 min: 15-minute timeframe.
- 30 min: 30-minute timeframe.
- 1 hour: 1 hour timeframe.
- 4 hours: 4-hour timeframe.
- 1 day: 1 day timeframe.
- 1 week: 1 week timeframe.
- 1 month: 1 month timeframe.