Definition #
HIGH levels are the highest prices an asset has reached over a certain period of time, such as a day, a week, or a year. Imagine the peak of a mountain on the price chart during that time.
Low levels are the lowest prices an asset has reached during that same period. Imagine the lowest point of a valley on a price chart during that time.
These points represent the extremes of trading during that period and are important because they often indicate where buying or selling power was strongest.
Interpretation #
The HIGH and LOW levels give us valuable information about price behavior:
- Support and Resistance: A previous LOW often acts as a support where the price may have difficulty falling further. A previous HIGH often acts as a resistance where the price may have difficulty rising further. This happens because there has been a lot of buying (at the lows) or selling (at the highs) at those levels in the past.
- Breakouts: If the price manages to rise and stay above a previous high, or fall and stay below a previous low, it is considered a “breakout.” This may indicate a change in trend.
- Trends: By observing a series of highs and lows, we can identify the general direction of the price. In an uptrend, the highs and lows tend to get higher and higher (higher highs/lows). In a downtrend, they tend to get lower and lower. If this pattern is broken, it could be a sign that the trend is changing (lower highs/lows).
- Reference Points: Traders often use HIGH and LOW levels to decide where to take profits (near a previous high) or where to stop losses (near a previous low).
Example #
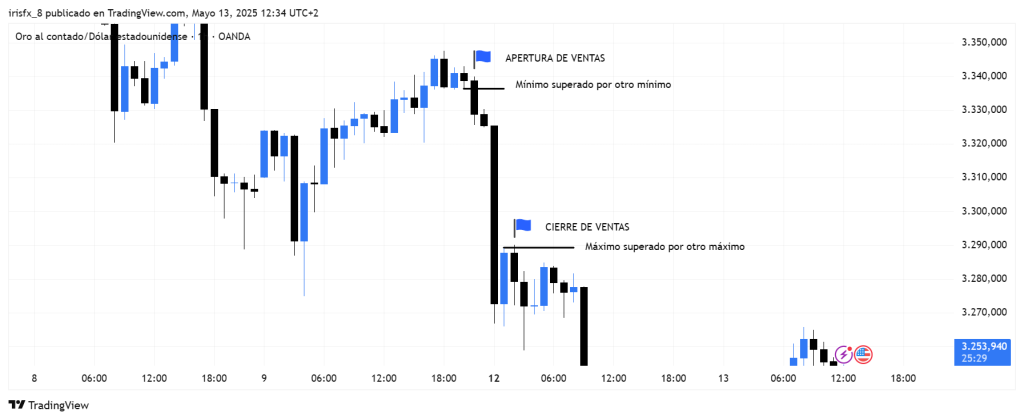
In this case, the high and low levels are based on the previous candle. Therefore, once the marked candle is surpassed by a lower level, a sell trade is opened.
When a candle exceeds the previous one by a maximum, it means that the trade is closed.
Parameters #
Signal type
Only in this case, the trigger mode exists, it offers a signal at the instant the condition of the elements occurs. For the rest of the time, even if the condition is maintained, the trigger mode will not give any more signals (until a new condition is reactivated).
NOTE: It is recommended to keep only one element with trigger signal type per rule, and the rest of the rule elements (optional) as filters.
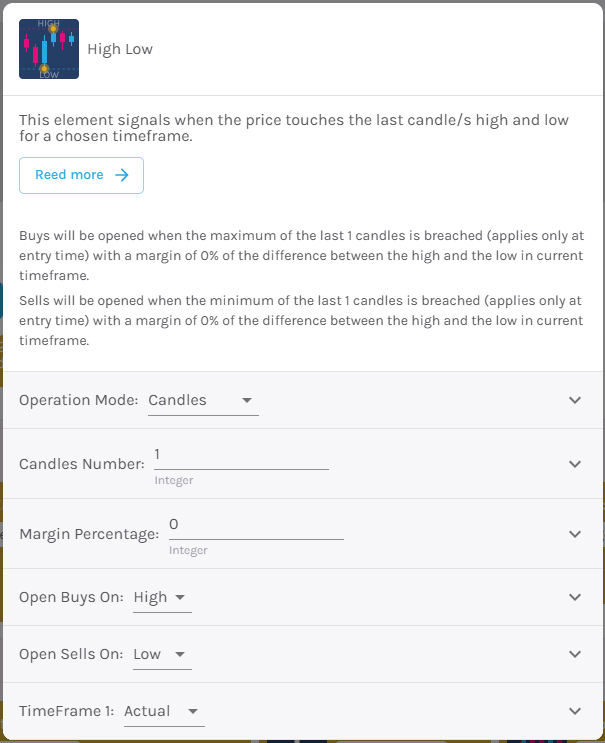
Parameters configuration
Operation mode – A candle period or a time period is considered [default: Candles].
Number of candles – Number of candles to consider [default: 1].
Margin Percentage – Extra distance the price has to cross to generate a signal, as a percentage of the initial distance [default: 0].
Open Buy position on – Select buy action, choosing between high or low [default: Bullish signal].
Open sales at – Select action for sales, choosing between high or low [default: Bearish signal].
Modo avanzado: Timeframe – Selecciona el Timeframe sobre el cual se aplicará el elemento. Estas son las opciones:
- Current: This refers to the timeframe associated with the strategy to be validated. For example, if our strategy is associated with the EURUSD in 15 minutes, the current timeframe will be 15 minutes. If we want to use this element with a different timeframe than the one used in the strategy, we can set it with the rest of the options.
- 1 min: 1 minute timeframe.
- 5 min: 5 minute timeframe.
- 15 min: 15-minute timeframe.
- 30 min: 30-minute timeframe.
- 1 hour: 1 hour timeframe.
- 4 hours: 4-hour timeframe.
- 1 day: 1 day timeframe.
- 1 week: 1 week timeframe.
- 1 month: 1 month timeframe.