Definition #
The Parabolic SAR is a system of “dots” placed above or below the price on a chart. These dots move as the price changes and help us identify the direction of the trend and possible points where that trend could stop or reverse. “SAR” stands for “Stop and Reverse,” which gives us a clue as to its main function: to indicate where we could stop a trade and consider a reversal.
Calculation #
The Parabolic SAR calculation is a little more complex, but the main idea is that the dots move faster as the trend strengthens.
- In an uptrend: SAR points are initially located below the price and gradually rise. If the price drops and touches one of these points, it is interpreted as a signal that the uptrend may have ended and a downtrend could begin. At that point, the SAR points reverse and begin to appear above the price.
- In a downtrend: The SAR points are initially positioned above the price and gradually decline. If the price rises and touches one of these points, it is interpreted as a signal that the downtrend may have ended and an uptrend could begin. At that point, the SAR points reverse and begin to appear below the price.
Interpretation #
The interpretation of the Parabolic SAR is quite straightforward:
- The dots below the price suggest that the current trend is bullish.
- The dots above the price suggest that the current trend is bearish.
- Trend Change: When the price crosses the SAR points, a potential trend change signal is generated.
- If the price that was above the bearish points crosses below them, it could be a signal to sell or open a short position.
- If the price that was below the bullish points crosses above them, it could be a signal to buy or open a long position.
- Use as Stop Loss: Many traders use SAR points as trailing stop loss levels. As the trend progresses, the SAR points.
Important to remember: The Parabolic SAR works best in markets with clear trends. In trading ranges or highly volatile markets, it can generate many false signals (trend changes that aren’t confirmed). Therefore, it’s often used in combination with other indicators to confirm signals.
Example #
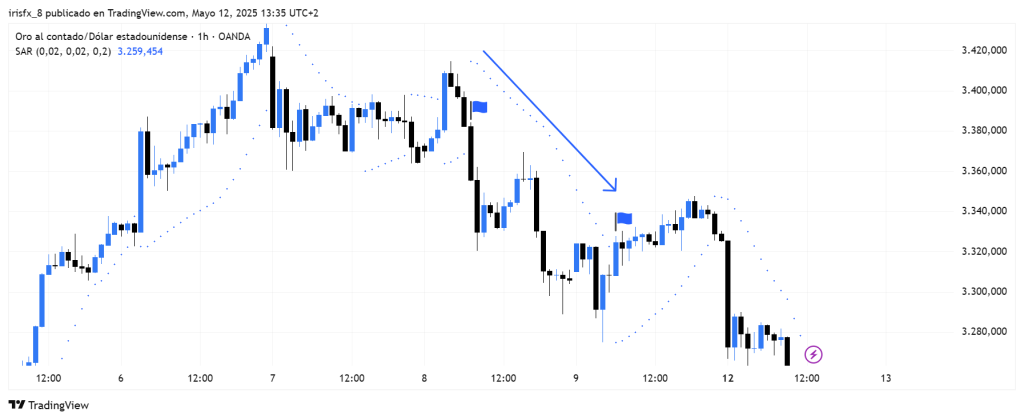
The parabolic SAR is represented by blue dots that move above or below the candles, showing the trend at that moment.
The moment the dots move up the candlesticks, a short position is opened; until the dots move down, indicating a change in trend, the short position is closed.
Parameters #
Signal type
The element can operate in two modes. In trigger mode, it provides a signal the instant the element condition occurs. At all other times, even if the condition persists, trigger mode will not provide further signals (until a new condition is reactivated). In filter mode, it will provide a signal as long as the element is generating a signal.
These are the 2 options:
- Filter: while the signal is produced
- Trigger: at the moment the signal is produced.
NOTE: It is recommended to keep only one element with trigger signal type per rule, and the rest of the rule elements (optional) as filters.
Parameters configuration
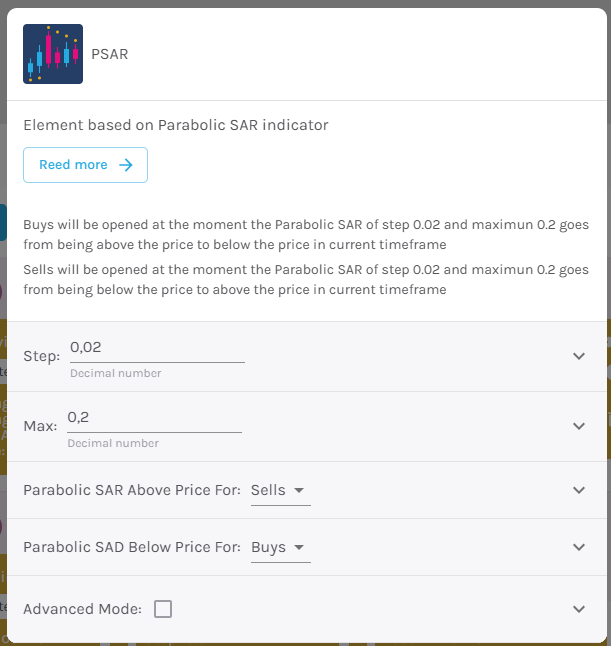
Step – The amount by which the acceleration factor increases each time a new maximum or minimum is reached [default: 0.02].
Maximum – This is the maximum value that the acceleration factor can reach [default: 0.2].
Parabolic SAR Above Price for – Sell or Buy [default: Sell].
Parabolic SAR Below Price for – Sell or Buy [default: Buy].
Open buy order on – Select buy action, choosing between bullish or bearish signal [default: Bullish signal].
Open sell order on – Select sell action, choosing between bullish or bearish signal [default: Bearish signal].
Modo avanzado: Timeframe – Selecciona el Timeframe sobre el cual se aplicará el elemento. Estas son las opciones:
- Current: This refers to the timeframe associated with the strategy to be validated. For example, if our strategy is associated with the EURUSD in 15 minutes, the current timeframe will be 15 minutes. If we want to use this element with a different timeframe than the one used in the strategy, we can set it with the rest of the options.
- 1 min: 1 minute timeframe.
- 5 min: 5 minute timeframe.
- 15 min: 15-minute timeframe.
- 30 min: 30-minute timeframe.
- 1 hour: 1 hour timeframe.
- 4 hours: 4-hour timeframe.
- 1 day: 1 day timeframe.
- 1 week: 1 week timeframe.
- 1 month: 1 month timeframe.