Definition #
It is the analysis of Fibonacci retracements and extensions to predict support and resistance levels in the markets. This technical analysis tool is based on the golden ratio, which is found in nature and manifests itself in financial market fluctuations.
Interpretation #
Important considerations:
- The Fibonacci sequence is an analytical tool, not an infallible prediction. Fibonacci levels should be used in conjunction with other indicators and technical analysis.
- Fibonacci retracements and extensions may not always be accurate and can vary depending on the market and timeframe.
- Knowledge and proper application of Fibonacci retracements and extensions are essential for successful trading.
Fibonacci Retracements – These are used to identify potential support or resistance levels during a correction in an uptrend or downtrend. Key percentages are 23.6%, 38.2%, 50%, 61.8%, and 76.4%. Lines are drawn between the high and low of a move to identify these levels.
Fibonacci Extensions – These are used to predict price targets after a retracement. Extensions are calculated using the same tool as retracements and are used to determine where a move might end.
Application – Traders use Fibonacci retracements and extensions to make entry and exit decisions, adjust their risk management, or even identify potential trend changes.
Example #
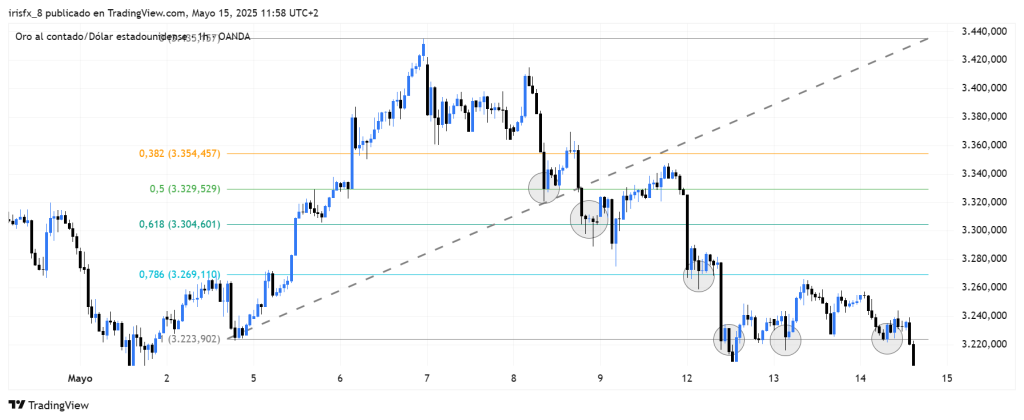
As we can see in this image, the Fibonacci indicator is marked with colored horizontal lines, which represent support zones for the asset that has reversed its trend. At some point, such as point 1 (where the uptrend begins), it touches the point several times until it finally breaks through.
Parameters #
Signal type
The element can operate in two modes. In trigger mode, it provides a signal the instant the element condition occurs. At all other times, even if the condition persists, trigger mode will not provide further signals (until a new condition is reactivated). In filter mode, it will provide a signal as long as the element is generating a signal.
These are the 2 options:
- Filter: while the signal is produced
- Trigger: at the moment the signal is produced.
NOTE: It is recommended to keep only one element with trigger signal type per rule, and the rest of the rule elements (optional) as filters.
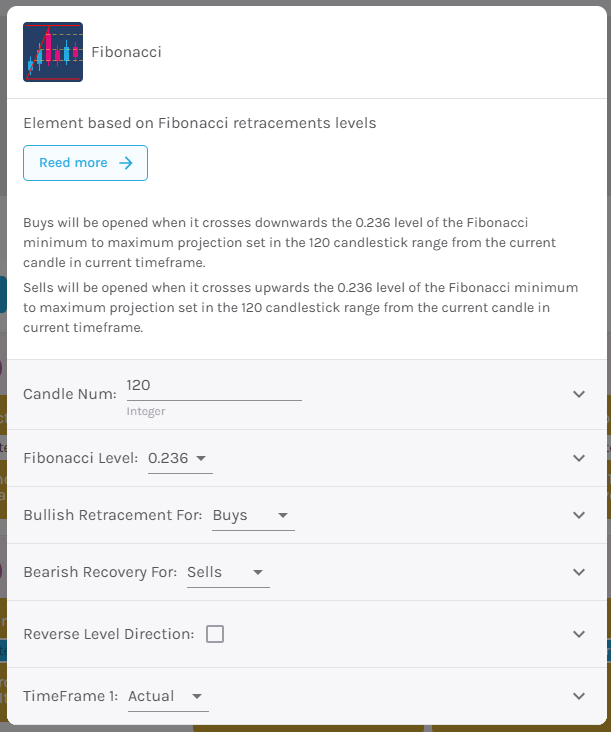
Parameters configuration
Number of candles – Number of candles that will be taken into account when making the parameter.
Fibonacci Level – Choose from 0.236; 0.382; 0.5; 0.618; 0.786; 0 and 1.
Bullish/Bearish Pullback for – Buy or Sell
Reverse Level Direction – By activating this option, the signal is generated when the previously pierced retracement level is recovered.
Advanced Mode: Timeframe – Select the TimeFrame on which the element will be applied.
- Current: This refers to the timeframe associated with the strategy to be validated. For example, if our strategy is associated with the EURUSD in 15 minutes, the current timeframe will be 15 minutes. If we want to use this element with a different timeframe than the one used in the strategy, we can set it with the rest of the options.
- 1 min: 1 minute timeframe.
- 5 min: 5 minute timeframe.
- 15 min: 15-minute timeframe.
- 30 min: 30-minute timeframe.
- 1 hour: 1 hour timeframe.
- 4 hours: 4-hour timeframe.
- 1 day: 1 day timeframe.
- 1 week: 1 week timeframe.
- 1 month: 1 month timeframe.