Definition #
The ZigZag is a technical analysis tool that draws straight lines connecting a series of significant highs and lows on a price chart. Its main purpose is to filter out smaller price movements and display larger price trends and patterns more clearly.
Calculation #
The ZigZag pattern is constructed by identifying highs and lows that meet certain percentage price movement criteria. For example, we could configure the ZigZag pattern to only draw a new line if the price moves at least 5% from the last plotted point.
When the price rises a certain percentage from a low, a high is marked, and a line is drawn from the previous low to that high. Then, if the price falls the required percentage from that high, a new low is marked, and a line is drawn from the previous high to this new low. This process continues, creating a series of lines that form a “zigzag” pattern.
Interpretation #
Identify the dominant trend by removing price noise, the general direction of the ZigZag lines can show whether the main trend is bullish (lines generally upward) or bearish (lines generally downward).
Detect potential support and resistance, where the high and low points of the ZigZag often act as levels where the price can find support or resistance.
The ZigZag can make patterns such as double tops, double bottoms, triangles, or Elliott wave formations easier to identify.
By marking significant highs and lows, the ZigZag can help measure Fibonacci retracement percentages within a trend.
Example #
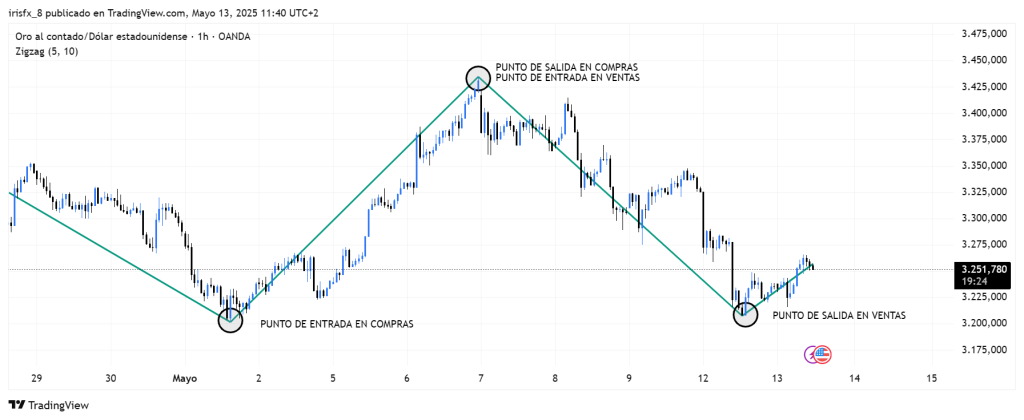
In the chart, we can see two trades. The first is a buy trade, which shows that the moment the trend line changes, the trade is opened. The same applies to closing the position; as soon as the trend line changes direction, we go from having a buy trade to closing and opening a sell trade.
Parameters #
Signal type
The element can operate in two modes. In trigger mode, it provides a signal the instant the element condition occurs. At all other times, even if the condition persists, trigger mode will not provide further signals (until a new condition is reactivated). In filter mode, it will provide a signal as long as the element is generating a signal.
These are the 2 options:
- Filter: while the signal is produced
- Trigger: at the moment the signal is produced.
NOTE: It is recommended to keep only one element with trigger signal type per rule, and the rest of the rule elements (optional) as filters.
Parameters configuration
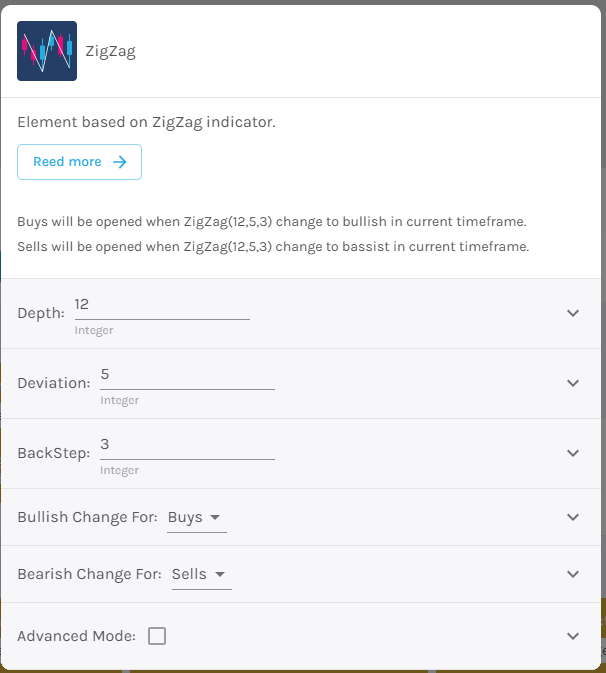
Depth – Depth of the indicator [default: 12].
Deviation – [default: 5].
BackStep – Must be smaller than depth [default: 3].
Bullish change for – Select action to buy, choosing between Buy or Sell [default: Buy].
Bearish Change for – Select action for sales, choosing between Buy or Sell [default: Sell].
Modo avanzado: Timeframe – Selecciona el Timeframe sobre el cual se aplicará el elemento. Estas son las opciones:
- Current: This refers to the timeframe associated with the strategy to be validated. For example, if our strategy is associated with the EURUSD in 15 minutes, the current timeframe will be 15 minutes. If we want to use this element with a different timeframe than the one used in the strategy, we can set it with the rest of the options.
- 1 min: 1 minute timeframe.
- 5 min: 5 minute timeframe.
- 15 min: 15-minute timeframe.
- 30 min: 30-minute timeframe.
- 1 hour: 1 hour timeframe.
- 4 hours: 4-hour timeframe.
- 1 day: 1 day timeframe.
- 1 week: 1 week timeframe.
- 1 month: 1 month timeframe.