Definition #
Instead of displaying the traditional candlesticks we normally see (with their opens, closes, highs, and lows), Heiken Ashi calculates and draws new candlesticks using formulas based on prices from the previous and current periods. The result is a smoother-looking chart that helps identify price trends more clearly, filtering out some of the “noise,” or small price movements.
Calculation #
Heiken Ashi candles don’t use the exact open, close, high, and low prices for each period. Instead, they calculate new “average” values:
Basically, each new Heiken Ashi candle takes information from the previous candle and the current candle to create a smoothed representation of price movement.
Interpretation #
Heiken Ashi candles are easier to interpret to identify trends:
- Strong Uptrend: Characterized by a series of Heiken Ashi candles with large green or blue bodies and few or no lower shadows. This suggests that the price is rising strongly and steadily.
- Strong Downtrend: Characterized by a series of Heiken Ashi candles with large red or black bodies and few or no upper shadows. This suggests that the price is steadily and strongly declining.
- Possible Trend Change or Consolidation: Small bodies with long shadows on both sides: Indicate indecision in the market and a possible consolidation or change in the trend.
- Trend Continuation: As long as the candles remain predominantly one color (usually green for bullish, red for bearish) and have shadows in the direction of the trend (upper shadow for bearish, lower shadow for bullish), the trend is likely to continue.
Example #
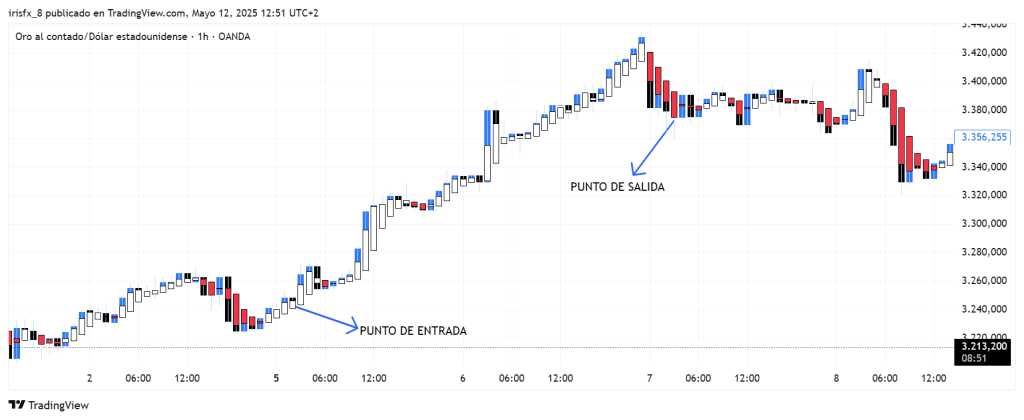
In this example, you can see a large upward movement, where the Heiken Ashi indicator displays bullish candles in white and bearish candles in red. In this case, a trade would be entered after three consecutive blank candles (bullish), and exited after three consecutive red candles (bearish).
Parameters #
Signal type
The element can operate in two modes. In trigger mode, it provides a signal the instant the element condition occurs. At all other times, even if the condition persists, trigger mode will not provide further signals (until a new condition is reactivated). In filter mode, it will provide a signal as long as the element is generating a signal.
These are the 2 options:
- Filter: while the signal is produced
- Trigger: at the moment the signal is produced.
NOTE: It is recommended to keep only one element with trigger signal type per rule, and the rest of the rule elements (optional) as filters.
Parameters configuration
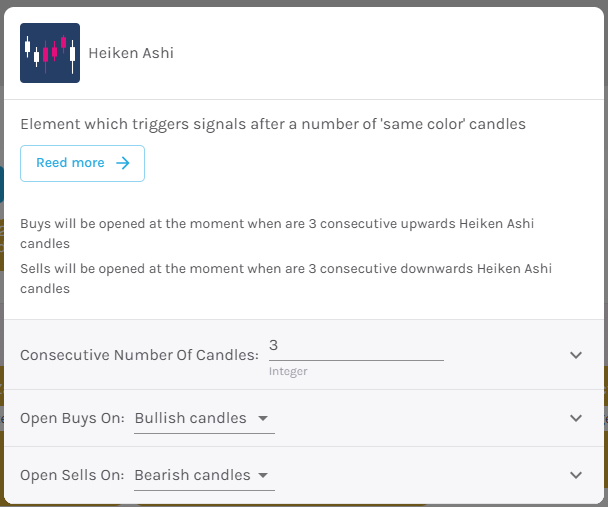
Number of candles to consider when giving a signal [default: 3].
Open buy order on – Select buy action, choosing between bullish or bearish signal [default: Bullish signal].
Open sell order on – Select sell action, choosing between bullish or bearish signal [default: Bearish signal].
Modo avanzado: Timeframe – Selecciona el Timeframe sobre el cual se aplicará el elemento. Estas son las opciones:
- Current: This refers to the timeframe associated with the strategy to be validated. For example, if our strategy is associated with the EURUSD in 15 minutes, the current timeframe will be 15 minutes. If we want to use this element with a different timeframe than the one used in the strategy, we can set it with the rest of the options.
- 1 min: 1 minute timeframe.
- 5 min: 5 minute timeframe.
- 15 min: 15-minute timeframe.
- 30 min: 30-minute timeframe.
- 1 hour: 1 hour timeframe.
- 4 hours: 4-hour timeframe.
- 1 day: 1 day timeframe.
- 1 week: 1 week timeframe.
- 1 month: 1 month timeframe.