Definition #
The crossover between price and a moving average is a very simple and popular way to identify potential trend changes in the market. The idea is to observe when the price crosses a line that represents the average of previous prices (the moving average). This crossover can be a signal to buy or sell, depending on the direction in which it occurs.
Calculation #
A moving average is a line formed by averaging the prices of the last few candles. For example, a 20-period moving average shows the average of the last 20 closes. This line is constantly updated and drawn on the price chart.
Interpretation #
When the price crosses above the moving average, it can be interpreted as the start of an uptrend, because the price is beginning to move above its recent average. Conversely, if the price falls below the average, it could be a sign of the beginning of a downtrend.
This crossover is very easy to see on the chart and is often used as confirmation in conjunction with other indicators. The longer the moving average period, the “softer” the signal will be; that is, it will provide fewer, but more reliable, signals.
Example #
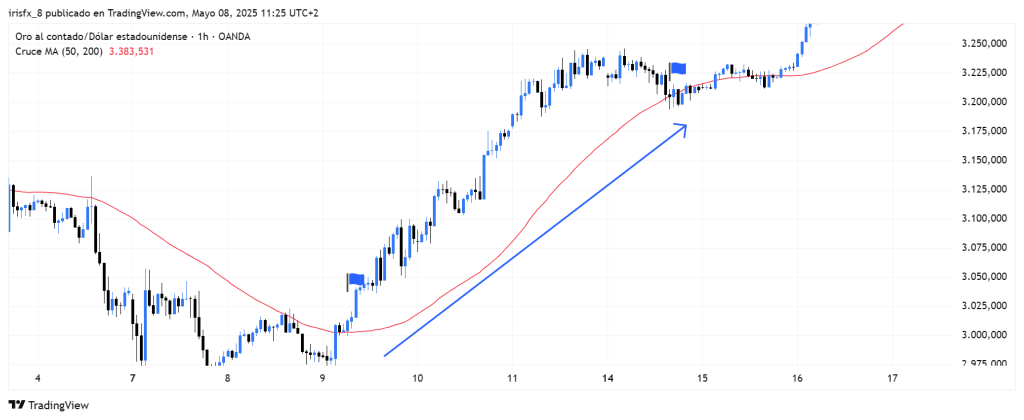
In this example, the moving average (MA) is 50 periods, colored red. As you can see, the point marked with the first flag shows the moment when this MA crosses with the candles pointing down, indicating the start of an uptrend, so we open a trade.
The moment the MA and the price cross again, we close the trade, and this is marked with the second flag.
Parameters #
Signal type
The element can operate in two modes. In trigger mode, it provides a signal the instant the element condition occurs. At all other times, even if the condition persists, trigger mode will not provide further signals (until a new condition is reactivated). In filter mode, it will provide a signal as long as the element is generating a signal.
These are the 2 options:
- Filter: while the signal is produced
- Trigger: at the moment the signal is produced.
NOTE: It is recommended to keep only one element with trigger signal type per rule, and the rest of the rule elements (optional) as filters.
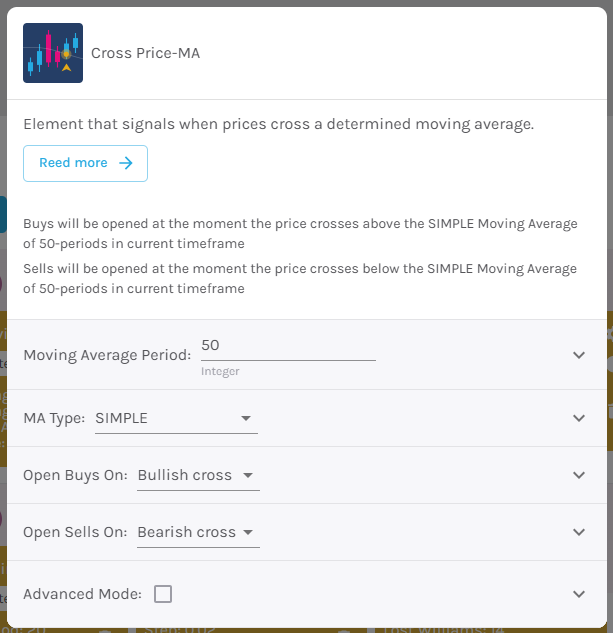
Parameters configuration
Moving Average Period – Number of candles to consider when giving a signal [default: 50].
Average type – Choose from simple, exponential, smoothed, and linear weighted.
Open buy order on – Select buy action, choosing between bullish or bearish signal [default: Bullish signal].
Open sell order on – Select sell action, choosing between bullish or bearish signal [default: Bearish signal].
Modo avanzado: Timeframe – Selecciona el Timeframe sobre el cual se aplicará el elemento. Estas son las opciones:
- Current: This refers to the timeframe associated with the strategy to be validated. For example, if our strategy is associated with the EURUSD in 15 minutes, the current timeframe will be 15 minutes. If we want to use this element with a different timeframe than the one used in the strategy, we can set it with the rest of the options.
- 1 min: 1 minute timeframe.
- 5 min: 5 minute timeframe.
- 15 min: 15-minute timeframe.
- 30 min: 30-minute timeframe.
- 1 hour: 1 hour timeframe.
- 4 hours: 4-hour timeframe.
- 1 day: 1 day timeframe.
- 1 week: 1 week timeframe.
- 1 month: 1 month timeframe.