Definition #
This indicator generates a signal when a candle forms whose range (the difference between its high and low price) is significantly greater than the recent average volatility, as measured by the ATR. The idea is to identify potential “breakouts,” or strong price movements that exceed normal market volatility.
Calculation #
For each candle, we would calculate the following:
- Candle Range: The difference between the high and low price of that candle.
- Actual ATR: The value of the Average True Range (ATR) Indicator at the time that candle closes (using a standard calculation period, such as 14).
The signal would be generated when the Candle Range is a certain multiple of the Current ATR. For example, we could define a signal as occurring when the Candle Range is twice the current ATR value.
In conclusion, the signal appears when a candle is “much larger” than normal compared to recent volatility.
Interpretation #
When a signal is generated, it suggests the following:
- Possible Breakout: A large candle that exceeds the average volatility may indicate the start of a strong price move in the direction of that candle.
- Increased Interest: A large candle often indicates a significant increase in buying or selling activity.
Possible Signals:
- Bullish Signal: If a candle forms with a close significantly higher than its open and its range is greater than a multiple of the ATR, it could be interpreted as a buy signal. The strength of the candle suggests strong buying pressure that exceeds normal volatility.
- Bearish Signal: If a candle forms with a close significantly lower than its open and its range is greater than a multiple of the ATR, it could be interpreted as a sell signal. The strength of the candle suggests strong selling pressure that exceeds normal volatility.
Important Considerations:
- ATR Multiple: The choice of ATR multiple is crucial. A smaller multiple will generate more (potentially more false) signals, while a larger multiple will generate fewer (but potentially more significant) signals.
- Candle Direction: It’s important to consider the direction of the large candle in relation to the current trend or key levels. A large candle in the direction of the trend could be more significant than one against it.
- Confirmation: As with any indicator, it is advisable to seek confirmation of this signal using other tools or patterns.
Example #
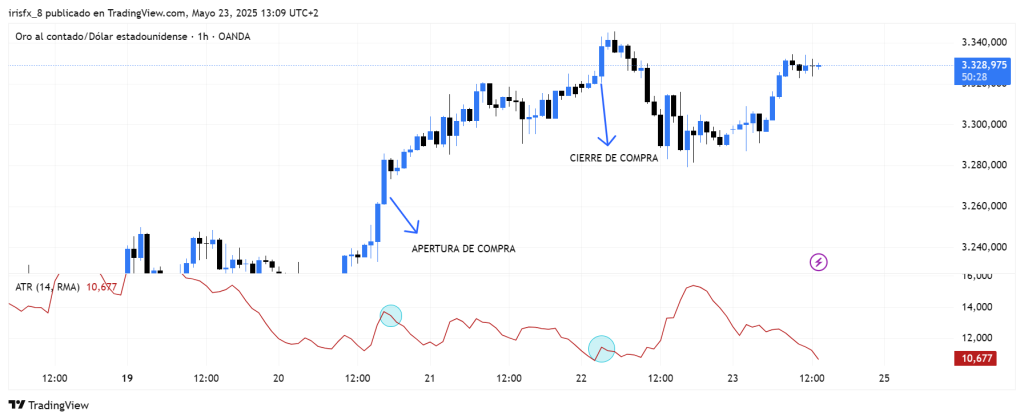
As we can see in the image, the ATR is located below the candlestick chart. A buy trade will be opened at the instant the distance between the candle’s high and low is greater than 2.5 times the ATR (the default value in the robot element). As shown, an open trade is made because the ATR is lower, indicated by the first circle. The trade will be closed later if the same thing happens again, and the candle exceeds the ATR level at that instant, indicated by the second circle.
Parameters #
Signal type
The element can operate in two modes. In trigger mode, it provides a signal the instant the element condition occurs. At all other times, even if the condition persists, trigger mode will not provide further signals (until a new condition is reactivated). In filter mode, it will provide a signal as long as the element is generating a signal.
These are the 2 options:
- Filter: while the signal is produced
- Trigger: at the moment the signal is produced.
NOTE: It is recommended to keep only one element with trigger signal type per rule, and the rest of the rule elements (optional) as filters.
Parameters configuration
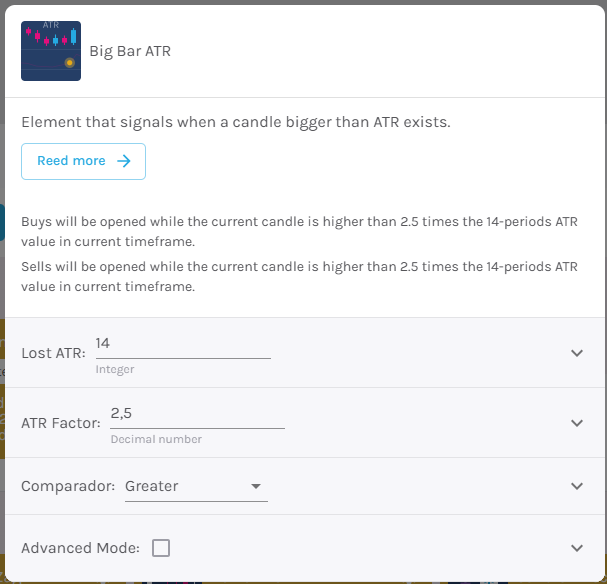
ATR Period – Select the period of the ATR indicator [default: 14]
ATR Factor – Select the number of times the current candle has moved relative to the ATR [default: 2.5]
Comparator – Type of comparison between the candle and the ATR. Choose from greater than, greater than or equal to, less than, and less than or equal to.
Modo avanzado: Timeframe – Selecciona el Timeframe sobre el cual se aplicará el elemento. Estas son las opciones:
- Current: This refers to the timeframe associated with the strategy to be validated. For example, if our strategy is associated with the EURUSD in 15 minutes, the current timeframe will be 15 minutes. If we want to use this element with a different timeframe than the one used in the strategy, we can set it with the rest of the options.
- 1 min: 1 minute timeframe.
- 5 min: 5 minute timeframe.
- 15 min: 15-minute timeframe.
- 30 min: 30-minute timeframe.
- 1 hour: 1 hour timeframe.
- 4 hours: 4-hour timeframe.
- 1 day: 1 day timeframe.
- 1 week: 1 week timeframe.
- 1 month: 1 month timeframe.