Definition #
Bollinger Bands are a tool used to determine whether an asset’s price is up or down compared to its recent performance. They are made up of three lines that move around the price: one in the middle (which is an average of the prices) and two that run above and below. These bands change shape and adapt according to market volatility.
Calculation #
This indicator is based on the prices of the last few candles. First, an average of the closing prices of the last 20 candles is calculated, which is the middle line. Then, the distance between prices and that average is calculated. With this information, two bands are created: an upper and a lower band. These bands are placed above and below the average and automatically adjust according to the strength of market movements. If there is a lot of variation, the bands move apart; if there is less variation, they move closer together.
Interpretation #
When the price approaches the upper band, it can be a sign that the price is high and could soon fall. If it approaches the lower band, it can mean that the price is low and could rise. If the bands are close together, the market is calm and could be about to make a strong move. If they are far apart, the market is moving very strongly.
This indicator doesn’t tell us whether we should buy or sell on its own, but it can be very helpful if used in conjunction with other indicators or candlestick patterns.
Example #
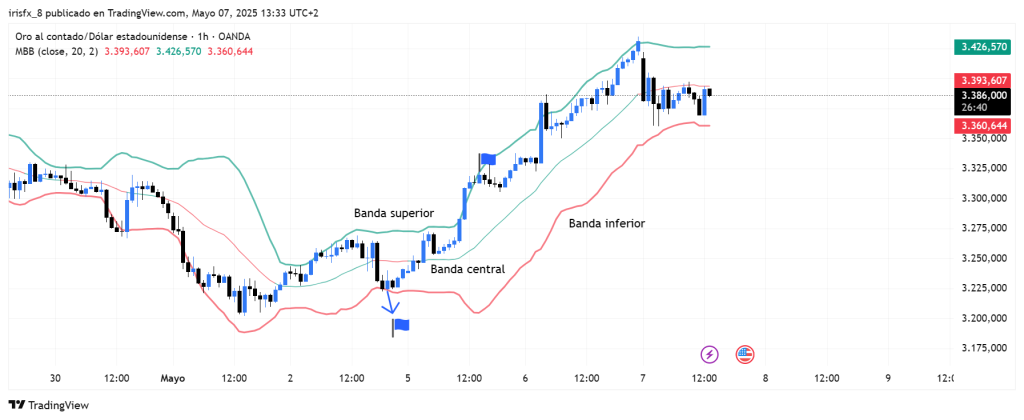
This chart shows the three bands (upper, middle, and lower). This is a buy example where the entry point, which is exactly when the candle crosses the lower band, is shown with a flag. The exit point, as shown, would be at the point where the candle crosses the upper band.
Parameters #
Signal type
The element can operate in two modes. In trigger mode, it provides a signal the instant the element condition occurs. At all other times, even if the condition persists, trigger mode will not provide further signals (until a new condition is reactivated). In filter mode, it will provide a signal as long as the element is generating a signal.
These are the 2 options:
- Filter: while the signal is produced
- Trigger: at the moment the signal is produced.
NOTE: It is recommended to keep only one element with trigger signal type per rule, and the rest of the rule elements (optional) as filters.
Parameters configuration
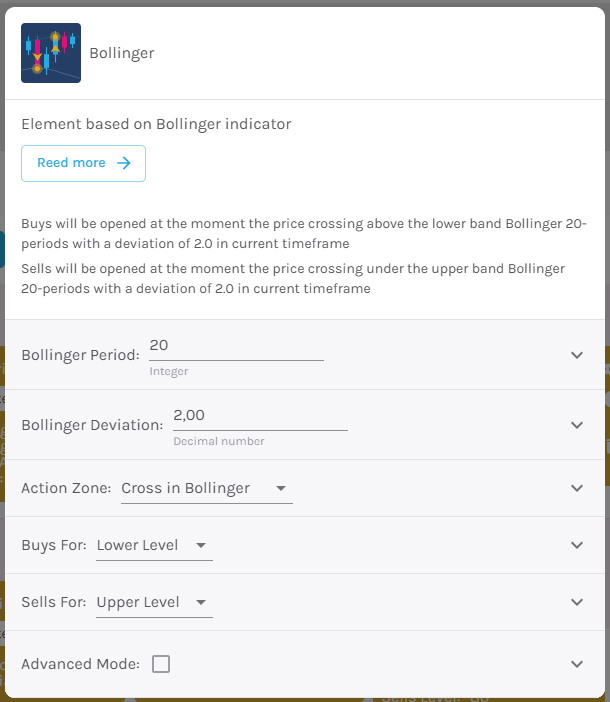
Bollinger Period – Number of candles to consider to give a signal [default: 20]
Bollinger Deviation – [default: 2]
Action Zone – Crossing into or out of the Bollinger Bands.
Open buy/sell – Choose between lower level, upper level or middle band.
Modo avanzado: Timeframe – Selecciona el Timeframe sobre el cual se aplicará el elemento. Estas son las opciones:
- Current: This refers to the timeframe associated with the strategy to be validated. For example, if our strategy is associated with the EURUSD in 15 minutes, the current timeframe will be 15 minutes. If we want to use this element with a different timeframe than the one used in the strategy, we can set it with the rest of the options.
- 1 min: 1 minute timeframe.
- 5 min: 5 minute timeframe.
- 15 min: 15-minute timeframe.
- 30 min: 30-minute timeframe.
- 1 hour: 1 hour timeframe.
- 4 hours: 4-hour timeframe.
- 1 day: 1 day timeframe.
- 1 week: 1 week timeframe.
- 1 month: 1 month timeframe.