Definition #
The RSI tells us how quickly and how strongly prices have changed recently. Rather than measuring the speed of a car, it measures the strength of upward and downward price movements. This helps us understand whether an asset is being bought or sold heavily.
Calculation #
To calculate the RSI, the indicator looks at price changes over a specific period (usually the last 14 periods). It then compares the strength of days when the price rose with the strength of days when the price fell.
The RSI gives us a number between 0 and 100 based on this comparison. A high number means the increases have been stronger than the decreases, and a low number means the opposite.
Interpretation #
The RSI value moves between 0 and 100, and key levels give us important clues:
- Overbought: When the RSI rises above 70, an asset is generally considered “overbought.” This means the price has risen too quickly and could be at risk of falling soon.
Oversold: When the RSI is below 30, the asset is generally considered “oversold.” This means the price has dropped too quickly and could be at risk of rising again soon.
- Middle Level (50): The 50 level can act as a midpoint. When the RSI is above 50, it suggests that bullish (buying) forces are generally stronger than bearish (selling) forces. When it is below 50, it suggests the opposite.
- Divergences: As with Stochastic, the RSI sometimes moves in the opposite direction to the asset’s price. This could be a sign of a possible reversal in the asset’s trend.
Example #
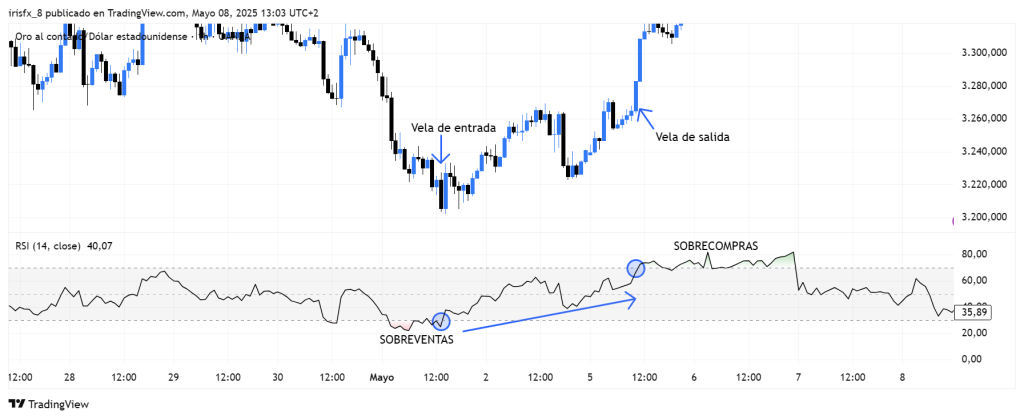
By default, the RSI is set to the average of the previous 14 candles. In this example, as soon as it breaks above the 30 horizontal line (oversold), a long trade is opened, which is closed when it breaks above the 70 line, indicating an overbought moment.
The chart shows the candle on which the asset would be bought, as well as the closing date for this transaction.
Parameters #
Signal type
The element can operate in two modes. In trigger mode, it provides a signal the instant the element condition occurs. At all other times, even if the condition persists, trigger mode will not provide further signals (until a new condition is reactivated). In filter mode, it will provide a signal as long as the element is generating a signal.
These are the 2 options:
- Filter: while the signal is produced
- Trigger: at the moment the signal is produced.
NOTE: It is recommended to keep only one element with trigger signal type per rule, and the rest of the rule elements (optional) as filters.
Parameters configuration
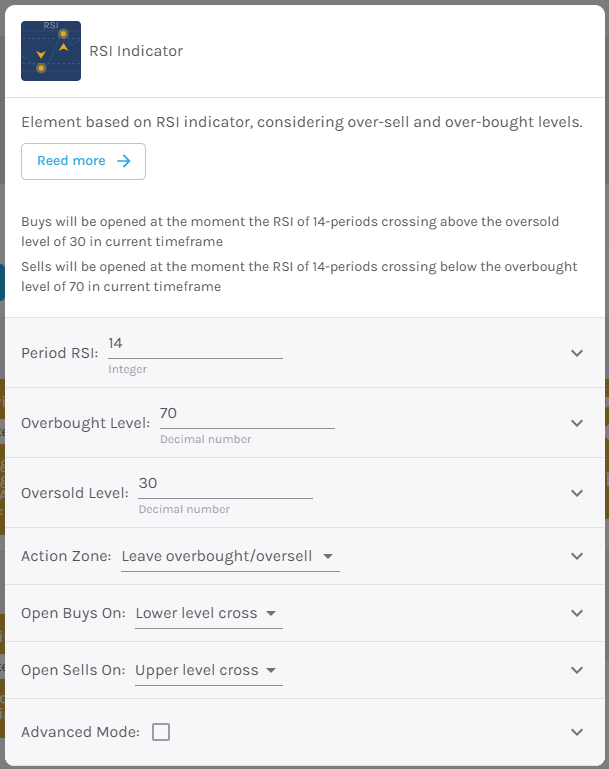
RSI Period – Number of candles to consider to give a signal [default: 14].
Overbought level – Point at which the price is considered overbought [default: 70].
Oversold Level – Point at which the price is considered oversold [default: 30].
Action Zone – Select the type of RSI signal, choosing between exiting overbought/oversold or entering overbought/oversold.
Open buy order on – Select buy action, choosing between bullish or bearish signal [default: Bullish signal].
Open sell order on – Select sell action, choosing between bullish or bearish signal [default: Bearish signal].
Modo avanzado: Timeframe – Selecciona el Timeframe sobre el cual se aplicará el elemento. Estas son las opciones:
- Current: This refers to the timeframe associated with the strategy to be validated. For example, if our strategy is associated with the EURUSD in 15 minutes, the current timeframe will be 15 minutes. If we want to use this element with a different timeframe than the one used in the strategy, we can set it with the rest of the options.
- 1 min: 1 minute timeframe.
- 5 min: 5 minute timeframe.
- 15 min: 15-minute timeframe.
- 30 min: 30-minute timeframe.
- 1 hour: 1 hour timeframe.
- 4 hours: 4-hour timeframe.
- 1 day: 1 day timeframe.
- 1 week: 1 week timeframe.
- 1 month: 1 month timeframe.