Definition #
It’s an indicator used to measure market psychology and identify potential overbought or oversold signals. It’s based on the idea that market psychology plays an important role in determining price movements.
Calculation #
Identifying Key Levels – The first step is to recognize the key levels that are relevant to the financial instrument you are trading, such as a currency pair. This can be done by reviewing historical price behavior and recording rounded figures where price has shown significant reactions in the past.
Price Action Observation – It’s essential to closely monitor price development as it approaches a psychological level. Pay attention to signs of increased volatility, as this may signal increased interest from market participants.
Defining Entry and Exit Points – After identifying a psychological level and analyzing the price behavior around it, use this information to determine entry and exit points for your trades. For example, if the price has bounced off a psychological support level, you might consider opening a long position just above that level, setting a stop loss slightly below it.
Interpretation #
Above 50 – Indicates that market psychology is bullish, so buyers dominate.
Below 50 – Indicates that market psychology is bearish, with sellers dominating.
Around 50 – Suggests a balance between buyers and sellers, with a sideways movement of the market.
Example #
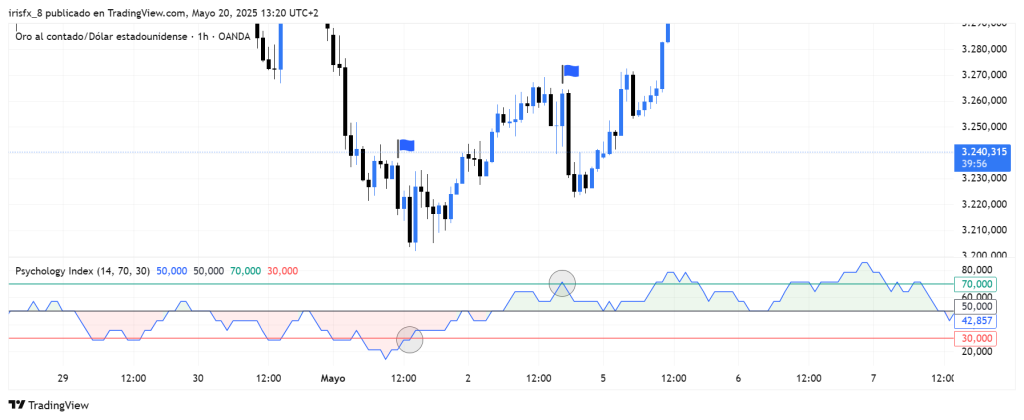
In the example, you can see the PSY indicator below the chart, with a blue line that moves up and down between levels 0 and 100. There are also three horizontal lines: the central line (50); the upper one, which indicates overbought (70); and the lower one, which indicates oversold (30).
In this case, you can see that as soon as it breaks through the lower line of 30, buy trades are opened, as this indicates a possible reversal into an uptrend. The trade is eventually closed when it touches the 70 point, as this indicates overbought conditions, i.e., a possible reversal.
Parameters #
Signal type
The element can operate in two modes. In trigger mode, it provides a signal the instant the element condition occurs. At all other times, even if the condition persists, trigger mode will not provide further signals (until a new condition is reactivated). In filter mode, it will provide a signal as long as the element is generating a signal.
These are the 2 options:
- Filter: while the signal is produced
- Trigger: at the moment the signal is produced.
NOTE: It is recommended to keep only one element with trigger signal type per rule, and the rest of the rule elements (optional) as filters.
Parameters configuration
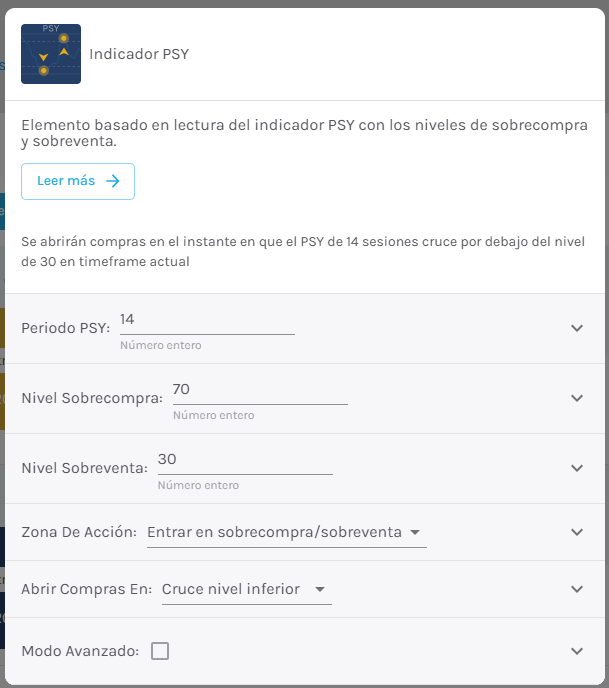
PSY Period – Number of candles to be taken into account by the indicator [default: 14]
Overbought level – [default: 70]
Oversold Level – [default: 30]
Action Zone – Signal that will trigger the element. Choose between “Enter Overbought/Oversold” or “Exit Overbought/Oversold”
Open buy order on – Select buy action, choosing between bullish or bearish signal [default: Bullish signal].
Open sell order on – Select sell action, choosing between bullish or bearish signal [default: Bearish signal].
Modo avanzado: Timeframe – Selecciona el Timeframe sobre el cual se aplicará el elemento. Estas son las opciones:
- Current: This refers to the timeframe associated with the strategy to be validated. For example, if our strategy is associated with the EURUSD in 15 minutes, the current timeframe will be 15 minutes. If we want to use this element with a different timeframe than the one used in the strategy, we can set it with the rest of the options.
- 1 min: 1 minute timeframe.
- 5 min: 5 minute timeframe.
- 15 min: 15-minute timeframe.
- 30 min: 30-minute timeframe.
- 1 hour: 1 hour timeframe.
- 4 hours: 4-hour timeframe.
- 1 day: 1 day timeframe.
- 1 week: 1 week timeframe.
- 1 month: 1 month timeframe.