Definition #
MACD is a tool that helps us see the “relationship” between two different price averages over time. MACD helps us identify potential changes in the direction and strength of that trend.
Calculation #
The MACD is calculated by subtracting a longer price average from a shorter price average. By default, price averages from the last 12 periods and the last 26 periods are used. The difference between these two averages creates the MACD line.
In addition, another average of the MACD line is calculated, usually over the last 9 periods. This is called the signal line.
Finally, a histogram is drawn showing the distance between the MACD line and the signal line. When the histogram is above zero, the MACD line is above the signal line, and when it is below zero, it is the opposite of it.
Interpretation #
The MACD gives us several important signals:
- Bullish Crossover: When the MACD line crosses above the signal line, it is considered a possible signal to buy.
- Bearish Crossover: When the MACD line crosses below the signal line, it is considered a possible signal to sell.
- When the MACD line crosses above zero, it indicates that the shorter price average is now above the longer average, which could signal a change to an uptrend.
- When the MACD line crosses below zero, it indicates that the shorter price average is now below the longer average, which could signal a change to a bearish trend.
- The histogram bars’ size shows us the strength of the movement. Larger bars indicate that the difference between the two lines is increasing, suggesting a stronger trend.
- When the histogram bars start to decrease, it suggests that the difference between the lines is narrowing, which could indicate that the trend is losing strength.
- Divergences (When the indicator and price do not match): As with other indicators, if the price is making new highs, but the MACD is not following suit (or vice versa), it could be a sign that the current trend is losing momentum and a change may be in the offing.
Example #
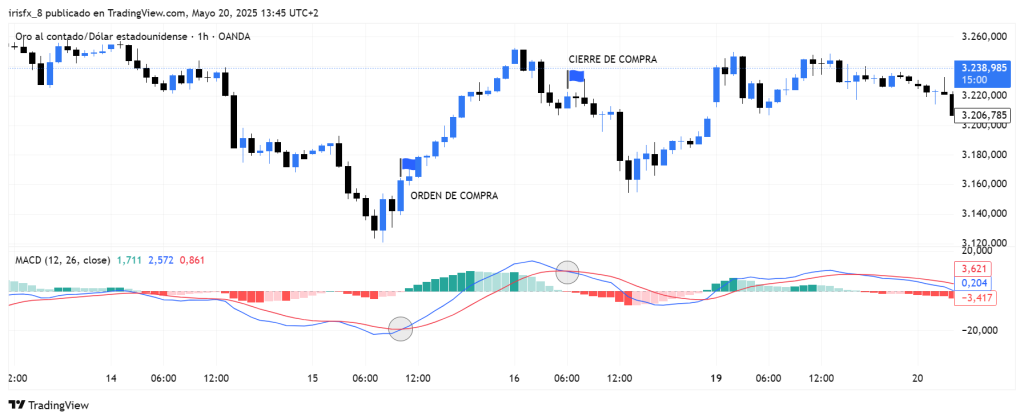
The Signal moving line is red, while the MACD is blue. When the MACD crosses upwards, it is considered an uptrend, and a buy order is opened. When these lines cross again, but in reverse, this order is closed.
Parameters #
Signal type
The element can operate in two modes. In trigger mode, it provides a signal the instant the element condition occurs. At all other times, even if the condition persists, trigger mode will not provide further signals (until a new condition is reactivated). In filter mode, it will provide a signal as long as the element is generating a signal.
These are the 2 options:
- Filter: while the signal is produced
- Trigger: at the moment the signal is produced.
NOTE: It is recommended to keep only one element with trigger signal type per rule, and the rest of the rule elements (optional) as filters.
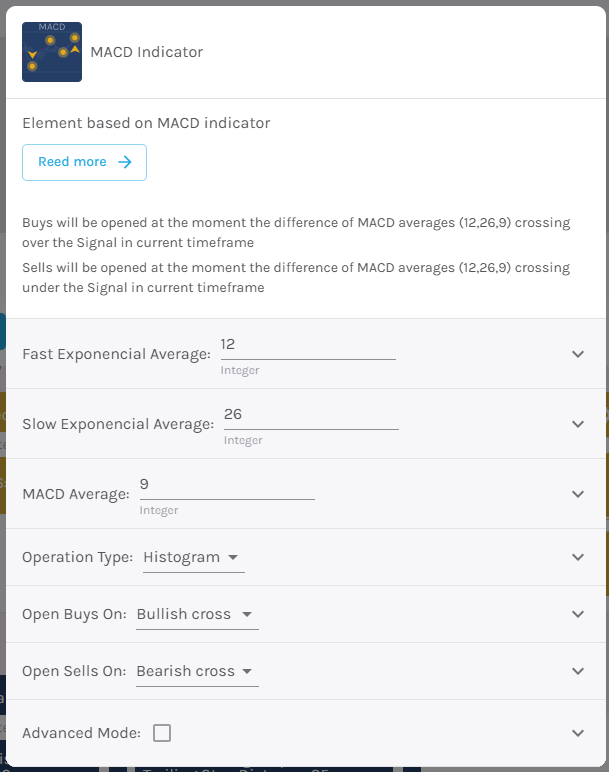
Configuration
Fast Exponential Average – Number of candles to consider when calculating the MACD [default: 12]
Slow Exponential Moving Average – Number of candles to consider when signaling the MACD [default: 26]
MACD Average – MACD Histogram Period [default: 9]
Trading Type – Select the signal type. Choose between histogram (when the histogram changes direction) or MACD (when the MACD is above or below 0).
Open buy order on – Select buy action, choosing between bullish or bearish signal [default: Bullish signal].
Open sell order on – Select sell action, choosing between bullish or bearish signal [default: Bearish signal].
Modo avanzado: Timeframe – Selecciona el Timeframe sobre el cual se aplicará el elemento. Estas son las opciones:
- Current: This refers to the timeframe associated with the strategy to be validated. For example, if our strategy is associated with the EURUSD in 15 minutes, the current timeframe will be 15 minutes. If we want to use this element with a different timeframe than the one used in the strategy, we can set it with the rest of the options.
- 1 min: 1 minute timeframe.
- 5 min: 5 minute timeframe.
- 15 min: 15-minute timeframe.
- 30 min: 30-minute timeframe.
- 1 hour: 1 hour timeframe.
- 4 hours: 4-hour timeframe.
- 1 day: 1 day timeframe.
- 1 week: 1 week timeframe.
- 1 month: 1 month timeframe.