Definition #
Stochastic is like a “radar” that helps us see if the price of something is at a high or low point compared to recent prices. Stochastic tells us if the price is near its highest point, its lowest point, or somewhere in between its recent movements. It helps us understand whether the current price is overvalued or undervalued relative to previous prices.
Calculation #
To calculate it, the indicator looks at the highest and lowest prices over a recent period (for example, the last two weeks). It then compares the current price to that price range.
Actually, two lines are calculated: one that moves faster and one that moves slower. The fast line gives us a more immediate view, and the slow line smooths out the movements a bit to make it easier to see the overall trend.
Interpretation #
The Stochastic moves in a range from 0 to 100, and the two lines that form it give us important signals:
- If the lines rise sharply and approach or exceed the number 80, it could mean the price has risen too quickly and may be “overbought.” This could suggest the price could decline soon.
- If the lines drop significantly and approach or fall below the number 20, it could mean the price has dropped too quickly and may be “oversold.” This could suggest the price could rise soon.
- When the fast line crosses above the slow line, especially when both are low, it could be a signal that the price might start to rise.
- When the fast line crosses below the slow line, especially when both are high, it could be a signal that the price might start to fall.
- Divergences (When the indicator and the price don’t match): Sometimes, the Stochastic moves in a different direction than the price, so it would be showing reversal signals.
Example #
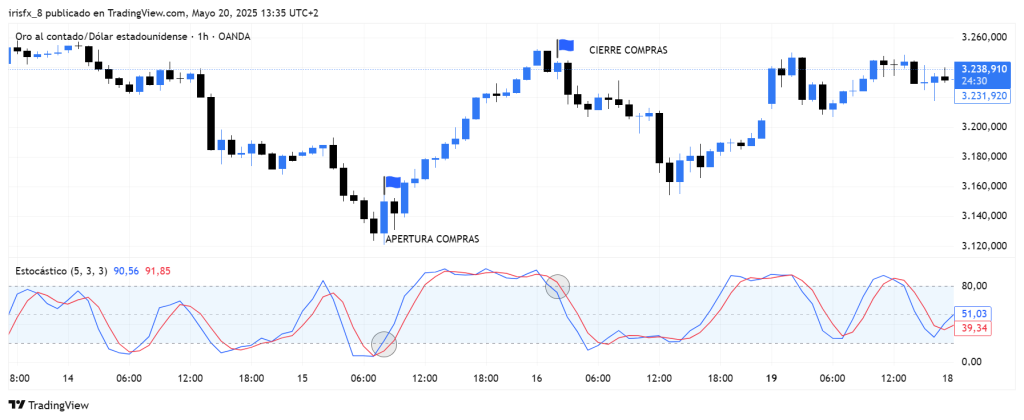
Considering the Stochastic, located below the chart, the moment both lines (Level K and Level D) cross point 20 (overbought) upwards, a long trade is opened. The trade will be closed the moment these lines cross point 80 (overbought) downwards, as this would indicate a possible trend reversal.
Parameters #
Signal type
The element can operate in two modes. In trigger mode, it provides a signal the instant the element condition occurs. At all other times, even if the condition persists, trigger mode will not provide further signals (until a new condition is reactivated). In filter mode, it will provide a signal as long as the element is generating a signal.
These are the 2 options:
- Filter: while the signal is produced
- Trigger: at the moment the signal is produced.
NOTE: It is recommended to keep only one element with trigger signal type per rule, and the rest of the rule elements (optional) as filters.
Parameters configuration
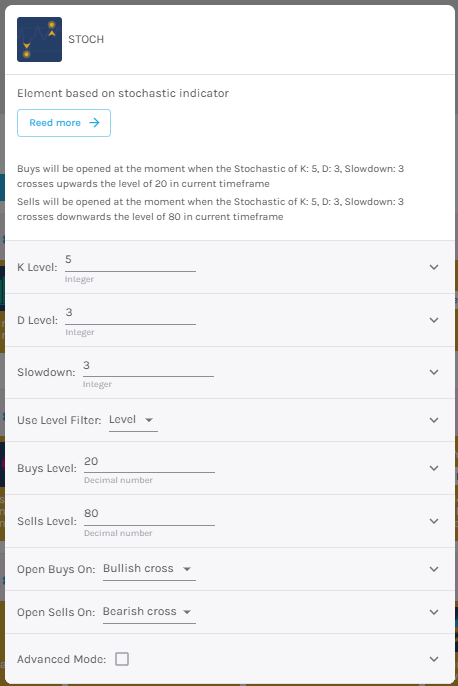
K Level – Difference between its maximum and minimum value during a specific period [default: 5].
Level D – Moving average of K [default: 3].
Slowdown – Smooths the Stochastic Oscillator line [default: 3].
Use Level Filter – Choose between level and crossing.
Buy level – Level at which you want to open the trade [default: 20].
Sell level – Level at which you want to open the operation [default: 80].
Open buy order on – Select buy action, choosing between bullish or bearish signal [default: Bullish signal].
Open sell order on – Select sell action, choosing between bullish or bearish signal [default: Bearish signal].
Modo avanzado: Timeframe – Selecciona el Timeframe sobre el cual se aplicará el elemento. Estas son las opciones:
- Current: This refers to the timeframe associated with the strategy to be validated. For example, if our strategy is associated with the EURUSD in 15 minutes, the current timeframe will be 15 minutes. If we want to use this element with a different timeframe than the one used in the strategy, we can set it with the rest of the options.
- 1 min: 1 minute timeframe.
- 5 min: 5 minute timeframe.
- 15 min: 15-minute timeframe.
- 30 min: 30-minute timeframe.
- 1 hour: 1 hour timeframe.
- 4 hours: 4-hour timeframe.
- 1 day: 1 day timeframe.
- 1 week: 1 week timeframe.
- 1 month: 1 month timeframe.